Introduction to the trendminer R package
Alexander Lemm
Source:vignettes/trendminer.Rmd
trendminer.RmdTrendMiner is an industrial self-service analytics platform for analyzing, monitoring and predicting time-series based process and asset data. The trendminer R package allows access to selected endpoints of the TrendMiner API which is documented here: http://developer.trendminer.com/.
This vignette provides a brief introduction to the trendminer R package, highlighting the following key details of its use:
- Connecting to a TrendMiner instance from an interactive R session
- Searching for assets and tags in the asset framework
- Browsing and visualizing structures in asset trees
- Fetching time series data of tags
- Visualizing tag-based time series data
Authentication
All requests to the TrendMiner API require authentication. This is achieved by sending a valid Bearer access token in the request headers. Request tokens are obtained via OAuth2.0 using the Resource Owner Password Credentials flow. That means that any client which likes to interact with the API needs to collect the credentials from the user (username and password) first before passing them together with its own client credentials (client ID and client secret) to the server. The server responds with an access token which the user needs to use for any subsequent API request.
Note: You can request your client ID and client secret by contacting TrendMiner support or your TrendMiner Customer Success Manager.
User credentials, client credentials and the TrendMiner base URL can be passed as arguments to tm_token() for quick testing in interactive mode.
token <- tm_token(client_id = "YOUR_CLIENT_ID_HERE",
           client_secret = "YOUR_CLIENT_SECRET_HERE",
           usr_name = "YOUR_USER_NAME_HERE",
           usr_pwd = "YOUR_USER_PASSWORD_HERE",
           base_url = "YOUR_TM_BASE_URL_HERE")
However, it is recommended to call tm_token() without arguments. In this case tm_token() will fetch the credentials and the TrendMiner base URL from the environment variables specified below which you need to store in .Renviron. You can easily edit .Renviron using usethis::edit_r_environ().
TM_client_ID = YOUR_CLIENT_ID_HERE
TM_client_secret = YOUR_CLIENT_SECRET_HERE
TM_usr = YOUR_USER_NAME_HERE
TM_pwd = YOUR_USER_PASSWORD_HERE
TM_base_url = YOUR_TM_BASE_URL_HERE
For any subsequent API request you just need to pass the token to the respective function as an argument.
Pagination (handling multi-page responses)
TrendMiner responses might be paginated. An internal function manages pagination automatically by combining all paginated search results in a data frame before returning them to the respective exported function that was called. This internal process for checking for further pages and combining the results is completely hidden from the end user.
The ... argument
Each function from the trendminer package comes with a ... (dot-dot-dot) argument. It is used to pass on additional arguments to the underlying HTTP method from the httr package. This might be necessary if you need to set some curl options explicitly via httr::config().
Function naming convention
To play nicely with tab completion, we use consistent prefixes:
-
tm_for all functions in the package -
tm_af_for functions wrapping endpoints of the TrendMiner asset framework API -
tm_ts_for functions wrapping endpoints of the TrendMiner time series API
Introduction to the TrendMiner asset framework
The TrendMiner asset framework is constructed around two primary concepts:
- Nodes
- Structures
A node either represents an asset (component of the plant) or a tag (attribute of an asset storing timeseries data).
A structure defines the parent-child relationship between assets and attributes or assets and other assets. It defines the logical place of a node in an asset tree. Since a node can be part of various asset trees at the same time, nodes and structures are defined separately.
This distinction between nodes (assets and tags) and structures is reflected accordingly in the trendminer R package: An asset framework related function either returns assets and tags if it is node related or it returns structures.
Since every structure represents a node at a particular level of an asset tree including the entire parent-child relationship path starting at the respective root, functions which return structures actually return two types of information at once:
- Information on the node the structure presents
- A single asset tree path including all the notes from the root until the node the structure represents
Connecting to a TrendMiner instance
We start by fetching a TrendMiner access token which we will need to pass to any subsequent API request. Usually, a token is valid for 12 hours and you can see its expiration date by printing the token to the console:
token
#> List of 8
#>  $ access_token     : chr "YOUR_ACCESS_TOKEN_WOULD_BE_SHOWN_HERE"
#>  $ token_type       : chr "bearer"
#>  $ expires_in       : int 24895
#>  $ scope            : chr "read"
#>  $ allowedHistorians: chr "ALL"
#>  $ userId           : chr "d891dff7-051d-4649-a389-029aa5b116de"
#>  $ expiration_date  : POSIXct[1:1], format: "2020-01-30 04:32:13"
#>  $ base_url         : chr "YOUR_TM_BASE_URL_WOULD_BE_SHOWN_HERE"
#> - attr(*, "class")= chr "tm_token"Browsing structures in an asset tree
The best way to start browsing your asset trees is to fetch all available root structures. They give you the entry points to the the different available asset trees:
roots <- tm_af_root_structures(token)
roots %>%
  select(structureId, name, nodeId, type)
#>                            structureId           name
#> 1 783249ff-bfc3-4453-bd6a-27d9e71f03e2   Site Cologne
#> 2 2b66622f-83c7-48e9-9ccc-6dd9214e70c6 Site Barcelona
#> 3 ca12dc39-516d-4217-b7cc-a8d220a32858  Site Grenoble
#>                                 nodeId  type
#> 1 15529c52-ae81-4a23-a988-91e6551cb1a7 ASSET
#> 2 20d6b09f-d252-4e27-9dec-c4b89ef2c949 ASSET
#> 3 876381a3-3dac-42f8-b72b-eac9d7be42b8 ASSET
Next we might want to explore the root structure of site Barcelona a bit more by taking a look at its children. We will use tm_child_structures() for this task which returns child structures by parent structure ID.
tm_af_child_structures(token, roots$structureId[roots$name == "Site Barcelona"]) %>%
  select(structureId, nodeId, name, path, type, parentName)
#>                            structureId                               nodeId
#> 1 1aef0aa1-f942-441e-82d8-0c4bfe7208b3 af4c77ea-8629-466c-a552-374f9637e10b
#> 2 4e58e3ca-e57d-47b5-8619-20d39626116e 98bcd02d-cfd0-441f-ab84-f789fa9caa73
#>       name                                                              path
#> 1 Solvents 20d6b09fd2524e279decc4b89ef2c949.af4c77ea8629466ca552374f9637e10b
#> 2 Catalyst 20d6b09fd2524e279decc4b89ef2c949.98bcd02dcfd0441fab84f789fa9caa73
#>    type     parentName
#> 1 ASSET Site Barcelona
#> 2 ASSET Site Barcelona
We now could go on and continue calling tm_child_structures() on each level with all newly retrieved structure IDs until we reach the leaves to get to know the complete tree structure of the Site Barcelona root structure.
Alternatively, we can make use of tm_descendant_structures() that retrieves the entire asset subtree underneath a given structure. In the example below we would like to get the asset subtree structure underneath the Solvents asset:
solvents_str <- tm_af_descendant_structures(token,"1aef0aa1-f942-441e-82d8-0c4bfe7208b3")
solvents_str %>%
  select(name, parentName, type, tagName)
#>                     name parentName      type     tagName
#> 1              Reactor 2   Solvents     ASSET        <NA>
#> 2              Reactor 1   Solvents     ASSET        <NA>
#> 3  Reactor Concentration  Reactor 2 ATTRIBUTE  BA2:CONC.1
#> 4          Reactor Level  Reactor 2 ATTRIBUTE BA2:LEVEL.1
#> 5    Reactor Temperature  Reactor 2 ATTRIBUTE  BA2:TEMP.1
#> 6          Reactor Level  Reactor 1 ATTRIBUTE  BA:LEVEL.1
#> 7  Reactor Concentration  Reactor 1 ATTRIBUTE   BA:CONC.1
#> 8    Reactor Temperature  Reactor 1 ATTRIBUTE   BA:TEMP.1
#> 9         Reactor Status  Reactor 1 ATTRIBUTE BA:ACTIVE.1
#> 10        Reaction Phase  Reactor 1 ATTRIBUTE  BA:PHASE.1
Above you see the entire Solvents subtree in table format which was returned by tm_descendant_structures(). Even though all the information is present it is very hard for the human eye to depict the tree structure from the table.
Here we can leverage the data.tree package which allows to convert a data frame that includes tree information in table or network format into a tree structure. Printing the tree structure after the conversion to the console will give us a much better understanding about the asset subtree:
library(data.tree)

solvents_subtree <- FromDataFrameTable(solvents_str, pathName = "externalId")
print(solvents_subtree, "type", "tagName")
#>                            levelName      type     tagName
#> 1  Site Barcelona
#> 2   °--Solvents
#> 3       ¦--Reactor 2                     ASSET
#> 4       ¦   ¦--Reactor Concentration ATTRIBUTE  BA2:CONC.1
#> 5       ¦   ¦--Reactor Level         ATTRIBUTE BA2:LEVEL.1
#> 6       ¦   °--Reactor Temperature   ATTRIBUTE  BA2:TEMP.1
#> 7       °--Reactor 1                     ASSET
#> 8           ¦--Reactor Level         ATTRIBUTE  BA:LEVEL.1
#> 9           ¦--Reactor Concentration ATTRIBUTE   BA:CONC.1
#> 10          ¦--Reactor Temperature   ATTRIBUTE   BA:TEMP.1
#> 11          ¦--Reactor Status        ATTRIBUTE BA:ACTIVE.1
#> 12          °--Reaction Phase        ATTRIBUTE  BA:PHASE.1
Visualizing asset trees
There are several libraries available which allow you to plot tree structures. In this introduction we will use the network3D package and pass the tree structure we just created with the data.tree package above to the networkD3::diagonalNetwok() function:
library(networkD3)

diagonalNetwork(ToListExplicit(solvents_subtree$Solvents, unname = TRUE), fontSize = 14,
                height = 400, width = 600)
By adding some magrittr and purrr flavor you can even create tree plots for all root structures including all of their descendants in one go. Based on the breadth and depth of your asset hierarchy, however, that might be a very expensive call so use the code example below with caution:
Fetching and visualizing time series data of tags
All functions and examples we covered so far dealt with extracting and visualizing asset framework data using asset framework API functions. In this section we will now focus on TrendMiner time series API functions for tags.
In the examples below we will use the set of tags which are part of the Reactor 1 sub asset tree of site Barcelona which we already know from above:
reactor1_str <- tm_af_child_structures(token,"5a0d1bf8-f298-4946-b523-8dcd5194fbaf")
reactor1_str %>%
  select(parentName, name, type, tagName)
#>   parentName                  name      type     tagName
#> 1  Reactor 1         Reactor Level ATTRIBUTE  BA:LEVEL.1
#> 2  Reactor 1 Reactor Concentration ATTRIBUTE   BA:CONC.1
#> 3  Reactor 1   Reactor Temperature ATTRIBUTE   BA:TEMP.1
#> 4  Reactor 1        Reactor Status ATTRIBUTE BA:ACTIVE.1
#> 5  Reactor 1        Reaction Phase ATTRIBUTE  BA:PHASE.1
tm_ts_interpolated_data() lets you retrieve time series data by tag name. You need to define the start and the end time of the time series you like to fetch as POSIXct objects setting “UTC” as the timezone:
library(lubridate)

start <-  ymd_hms("2019-09-15T03:10:14Z")
end <- ymd_hms("2019-09-15T08:42:15Z")

ba_conc1_data <- tm_ts_interpolated_data(token, "BA:CONC.1", start, end, step = 2)
The maximum number of points tm_ts_interpolated_data() can return is 10.000. The step argument defines the time increment between returned observations. If you define step to be one second which is the default setting, the time interval you can select using the start and end arguments can span 2 hours, 46 minutes and 40 seconds (2 x 60 x 60 + 46 x 60 + 40 = 10.000) at most. Make sure to decrease the resolution by increasing the step argument if you like to fetch cohesive time series data of a tag which spans more than 10.000 seconds.
str(ba_conc1_data)
#> List of 2
#>  $ tag       :List of 3
#>   ..$ tagName          : chr "BA:CONC.1"
#>   ..$ shift            : int 0
#>   ..$ interpolationType: chr "linear"
#>  $ timeSeries:'data.frame':  9931 obs. of  2 variables:
#>   ..$ index: POSIXct[1:9931], format: "2019-09-15 03:11:00" "2019-09-15 03:11:02" ...
#>   ..$ value: num [1:9931] 0 0 0 0 0 0 0 0 0 0 ...
head(ba_conc1_data$timeSeries)
#>                 index value
#> 1 2019-09-15 03:11:00     0
#> 2 2019-09-15 03:11:02     0
#> 3 2019-09-15 03:11:04     0
#> 4 2019-09-15 03:11:06     0
#> 5 2019-09-15 03:11:08     0
#> 6 2019-09-15 03:11:10     0
summary(ba_conc1_data$timeSeries)
#>      index                         value
#>  Min.   :2019-09-15 03:11:00   Min.   : 0.000
#>  1st Qu.:2019-09-15 04:33:45   1st Qu.: 9.878
#>  Median :2019-09-15 05:56:30   Median :21.713
#>  Mean   :2019-09-15 05:56:30   Mean   :22.393
#>  3rd Qu.:2019-09-15 07:19:15   3rd Qu.:39.378
#>  Max.   :2019-09-15 08:42:00   Max.   :46.488
There are plenty of time series plotting options available in R. Since tm_ts_interpolated_data() returns the time series of the tag in a data frame we will use ggplot in our plotting examples below.
We start by visualizing the time series data we just downloaded for tag BA:CONC.1:
library(ggplot2)

ba_conc1_data$timeSeries %>%
  ggplot(aes(index, value)) +
  geom_line(color = "#09557f") +
  ggtitle(ba_conc1_data$tag$tagName) +
  theme_minimal()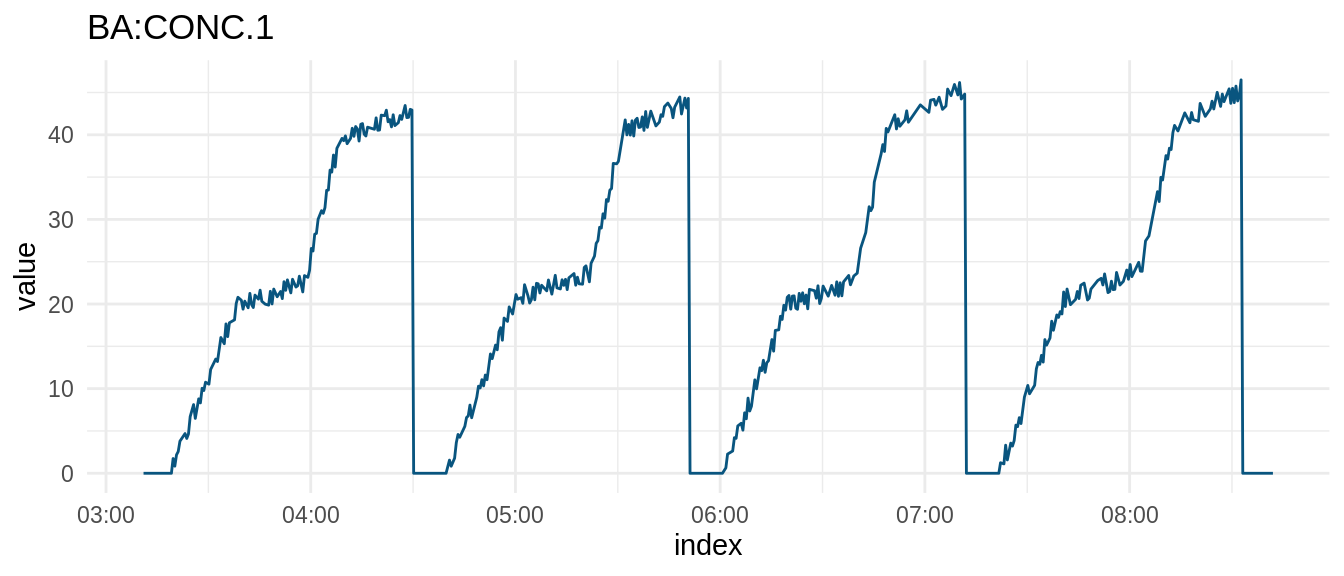
If you know that the tags you are interested in operate on the same scale you can fetch and visualize their data in one go my chaining several purrr::map() calls together. Below, however, we will break the data fetching and visualizing process into two steps to explain some of the underlying details.
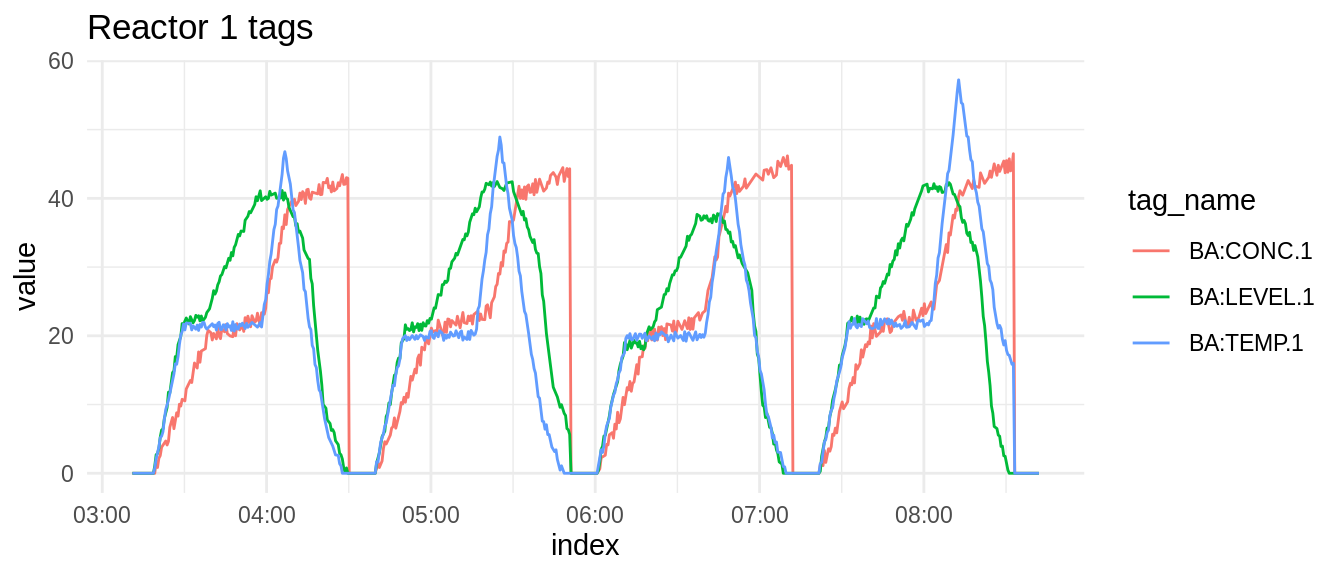
We start by selecting three tags from Reactor 1 whose time series data we like to extract from TrendMiner. We fetch their data and store the results in a single combined data frame on top of each other in long format. Because ggplot needs a data frame in long format including a group variable when plotting a multivariate time series, we make sure to add an additional group column tag_name to the data frame:
tags <- reactor1_str$tagName
tags <- tags[1:3]
tags
#> [1] "BA:LEVEL.1" "BA:CONC.1"  "BA:TEMP.1"

combined_data <- map(tags, ~ tm_ts_interpolated_data(token, .x,  start, end, 2)) %>%
  map_dfr( ~ .x[["timeSeries"]] %>%
             mutate(
               tag_name = .x[["tag"]][["tagName"]]
              ))
We can now directly plot our data without further processing:
combined_data %>%
  ggplot(aes(index, value)) +
  geom_line(aes(color = tag_name)) +
  ggtitle("Reactor 1 tags")+
  theme_minimal()